USA Snow Storm Visualized
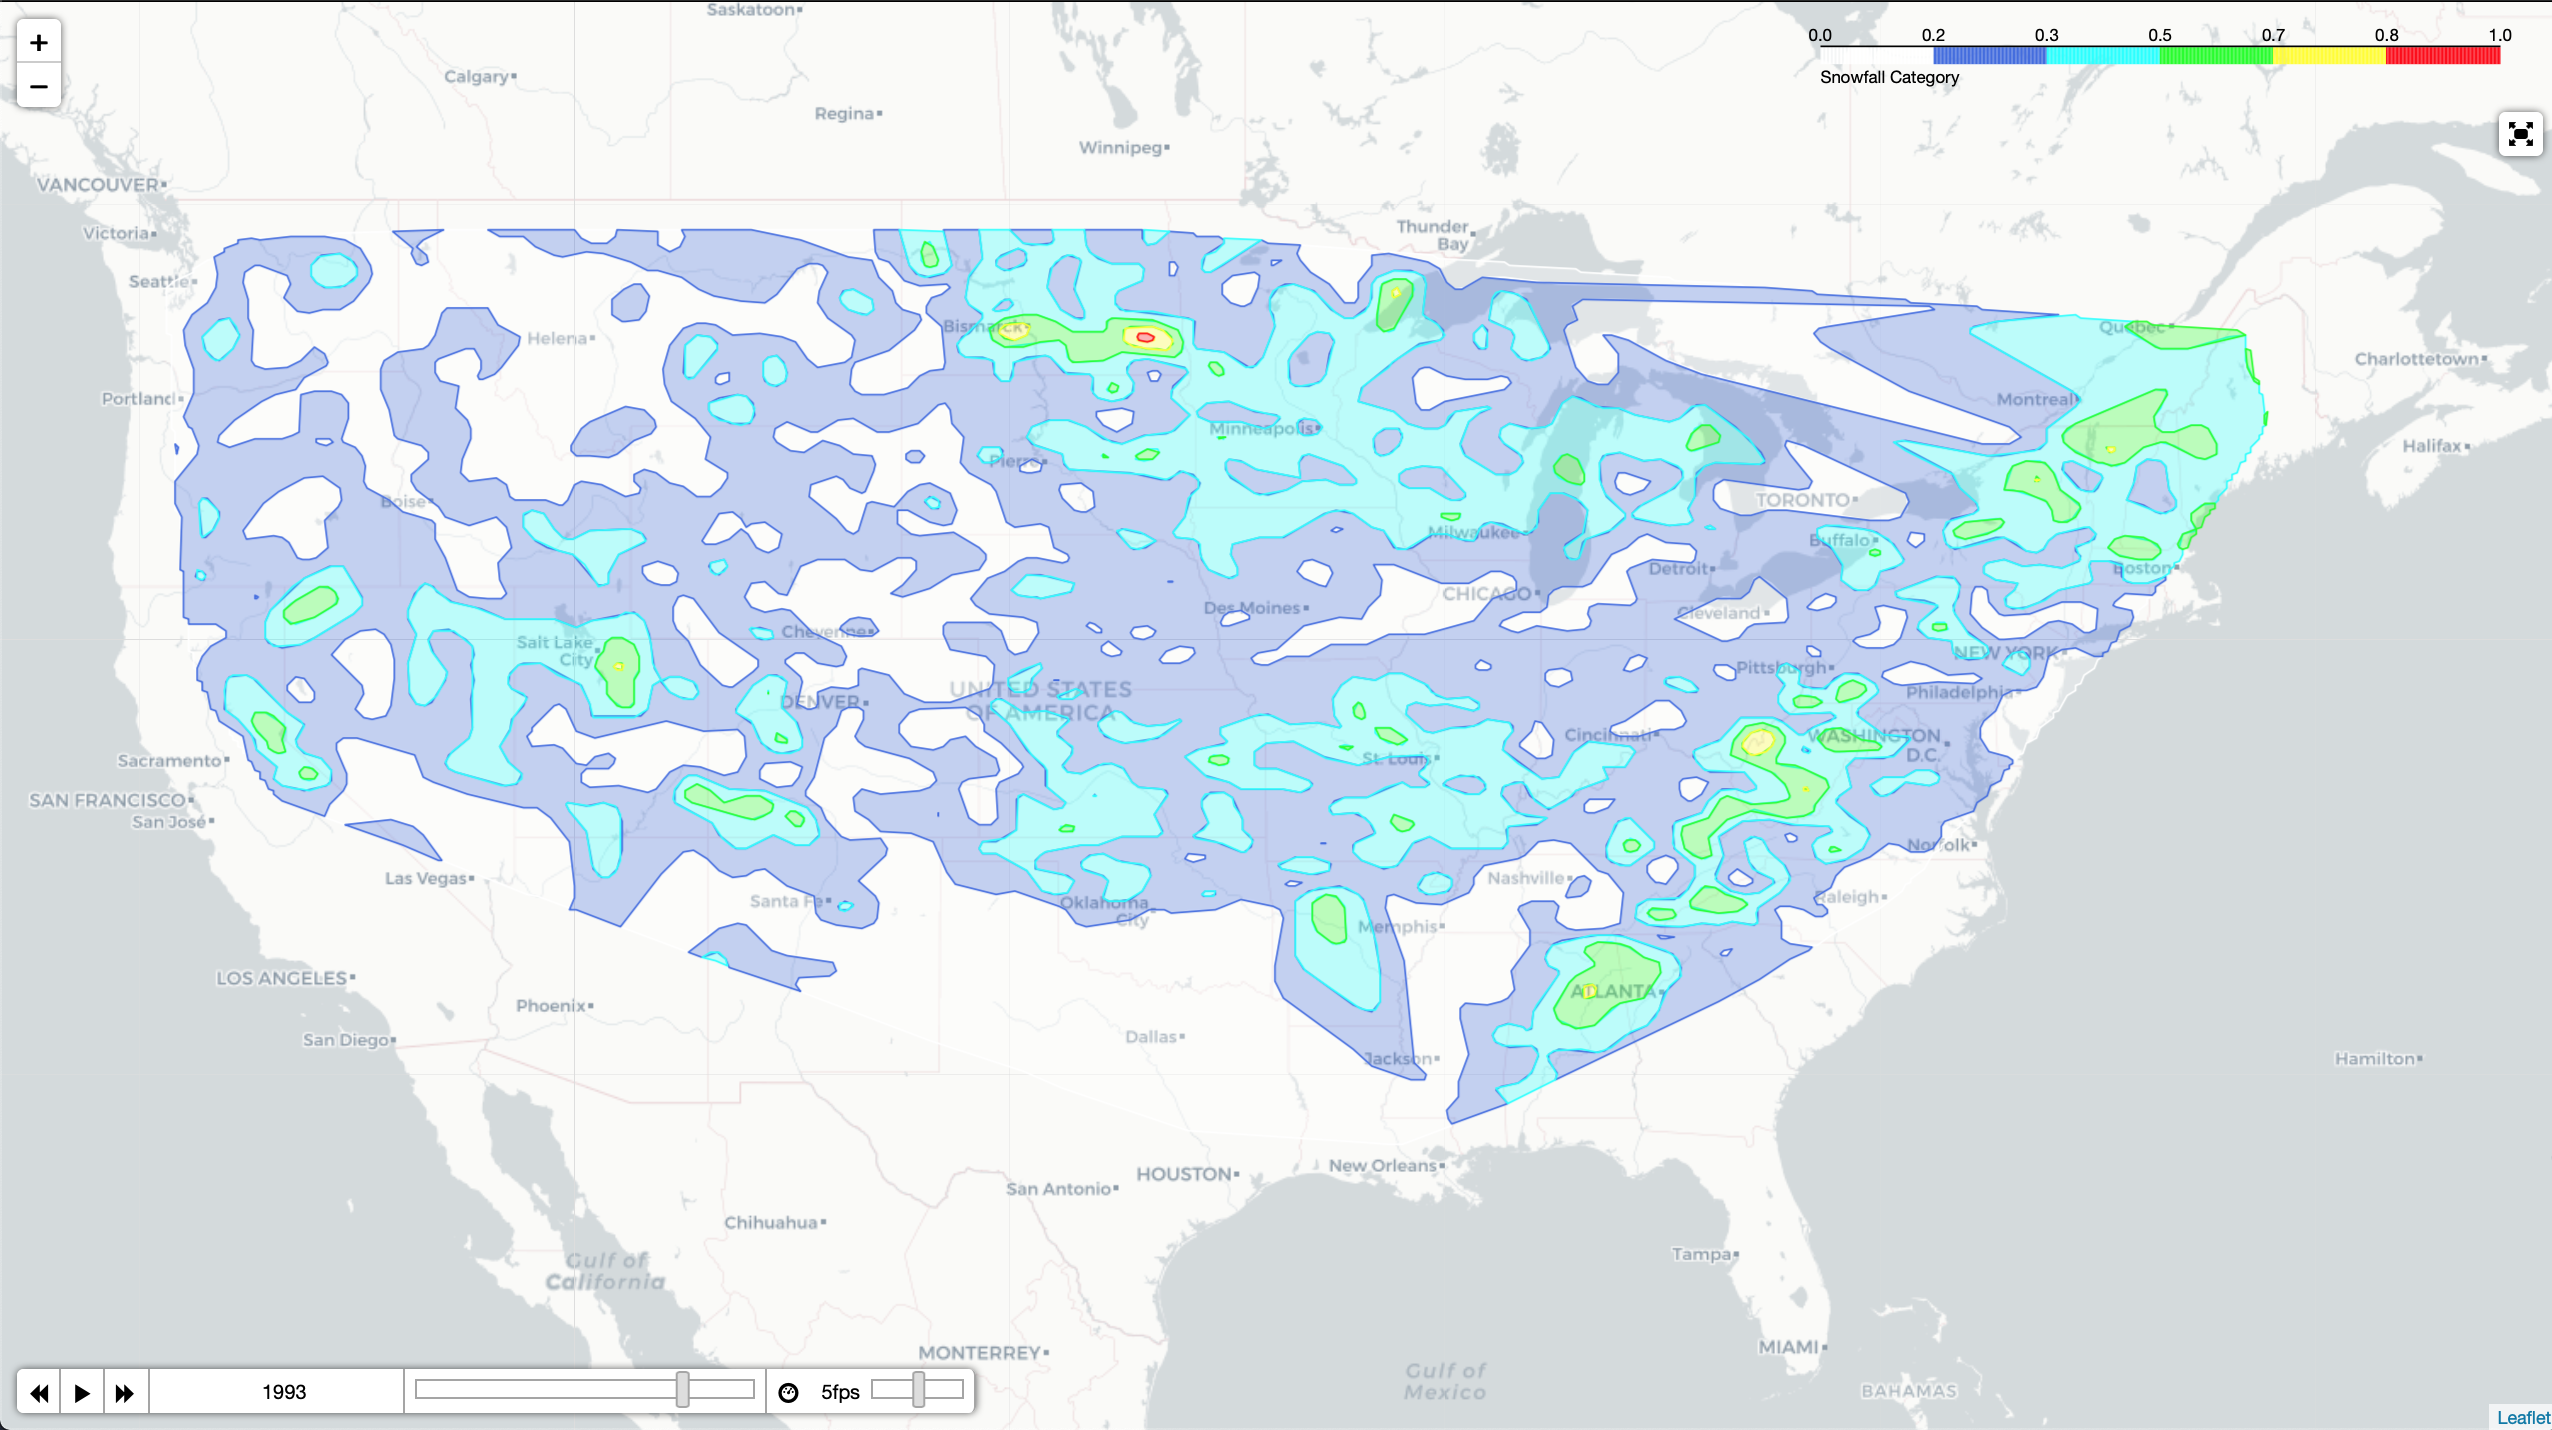
Based on the data from National Oceanic and Atmospheric Administration(NOAA), https://data.nodc.noaa.gov/cgi-bin/iso?id=gov.noaa.ncdc:C00464 the snow storms from 1900-2019 in USA has been visualized, using Folium. The data was scraped from the website and processed using Python.
Link to viz: https://samirak93.github.io/snow/index.html
Viz Output:
The code (to scrape, process and build visualization) can be found in Complete_Notebook.ipynb
Feedbacks and comments appreciated :)