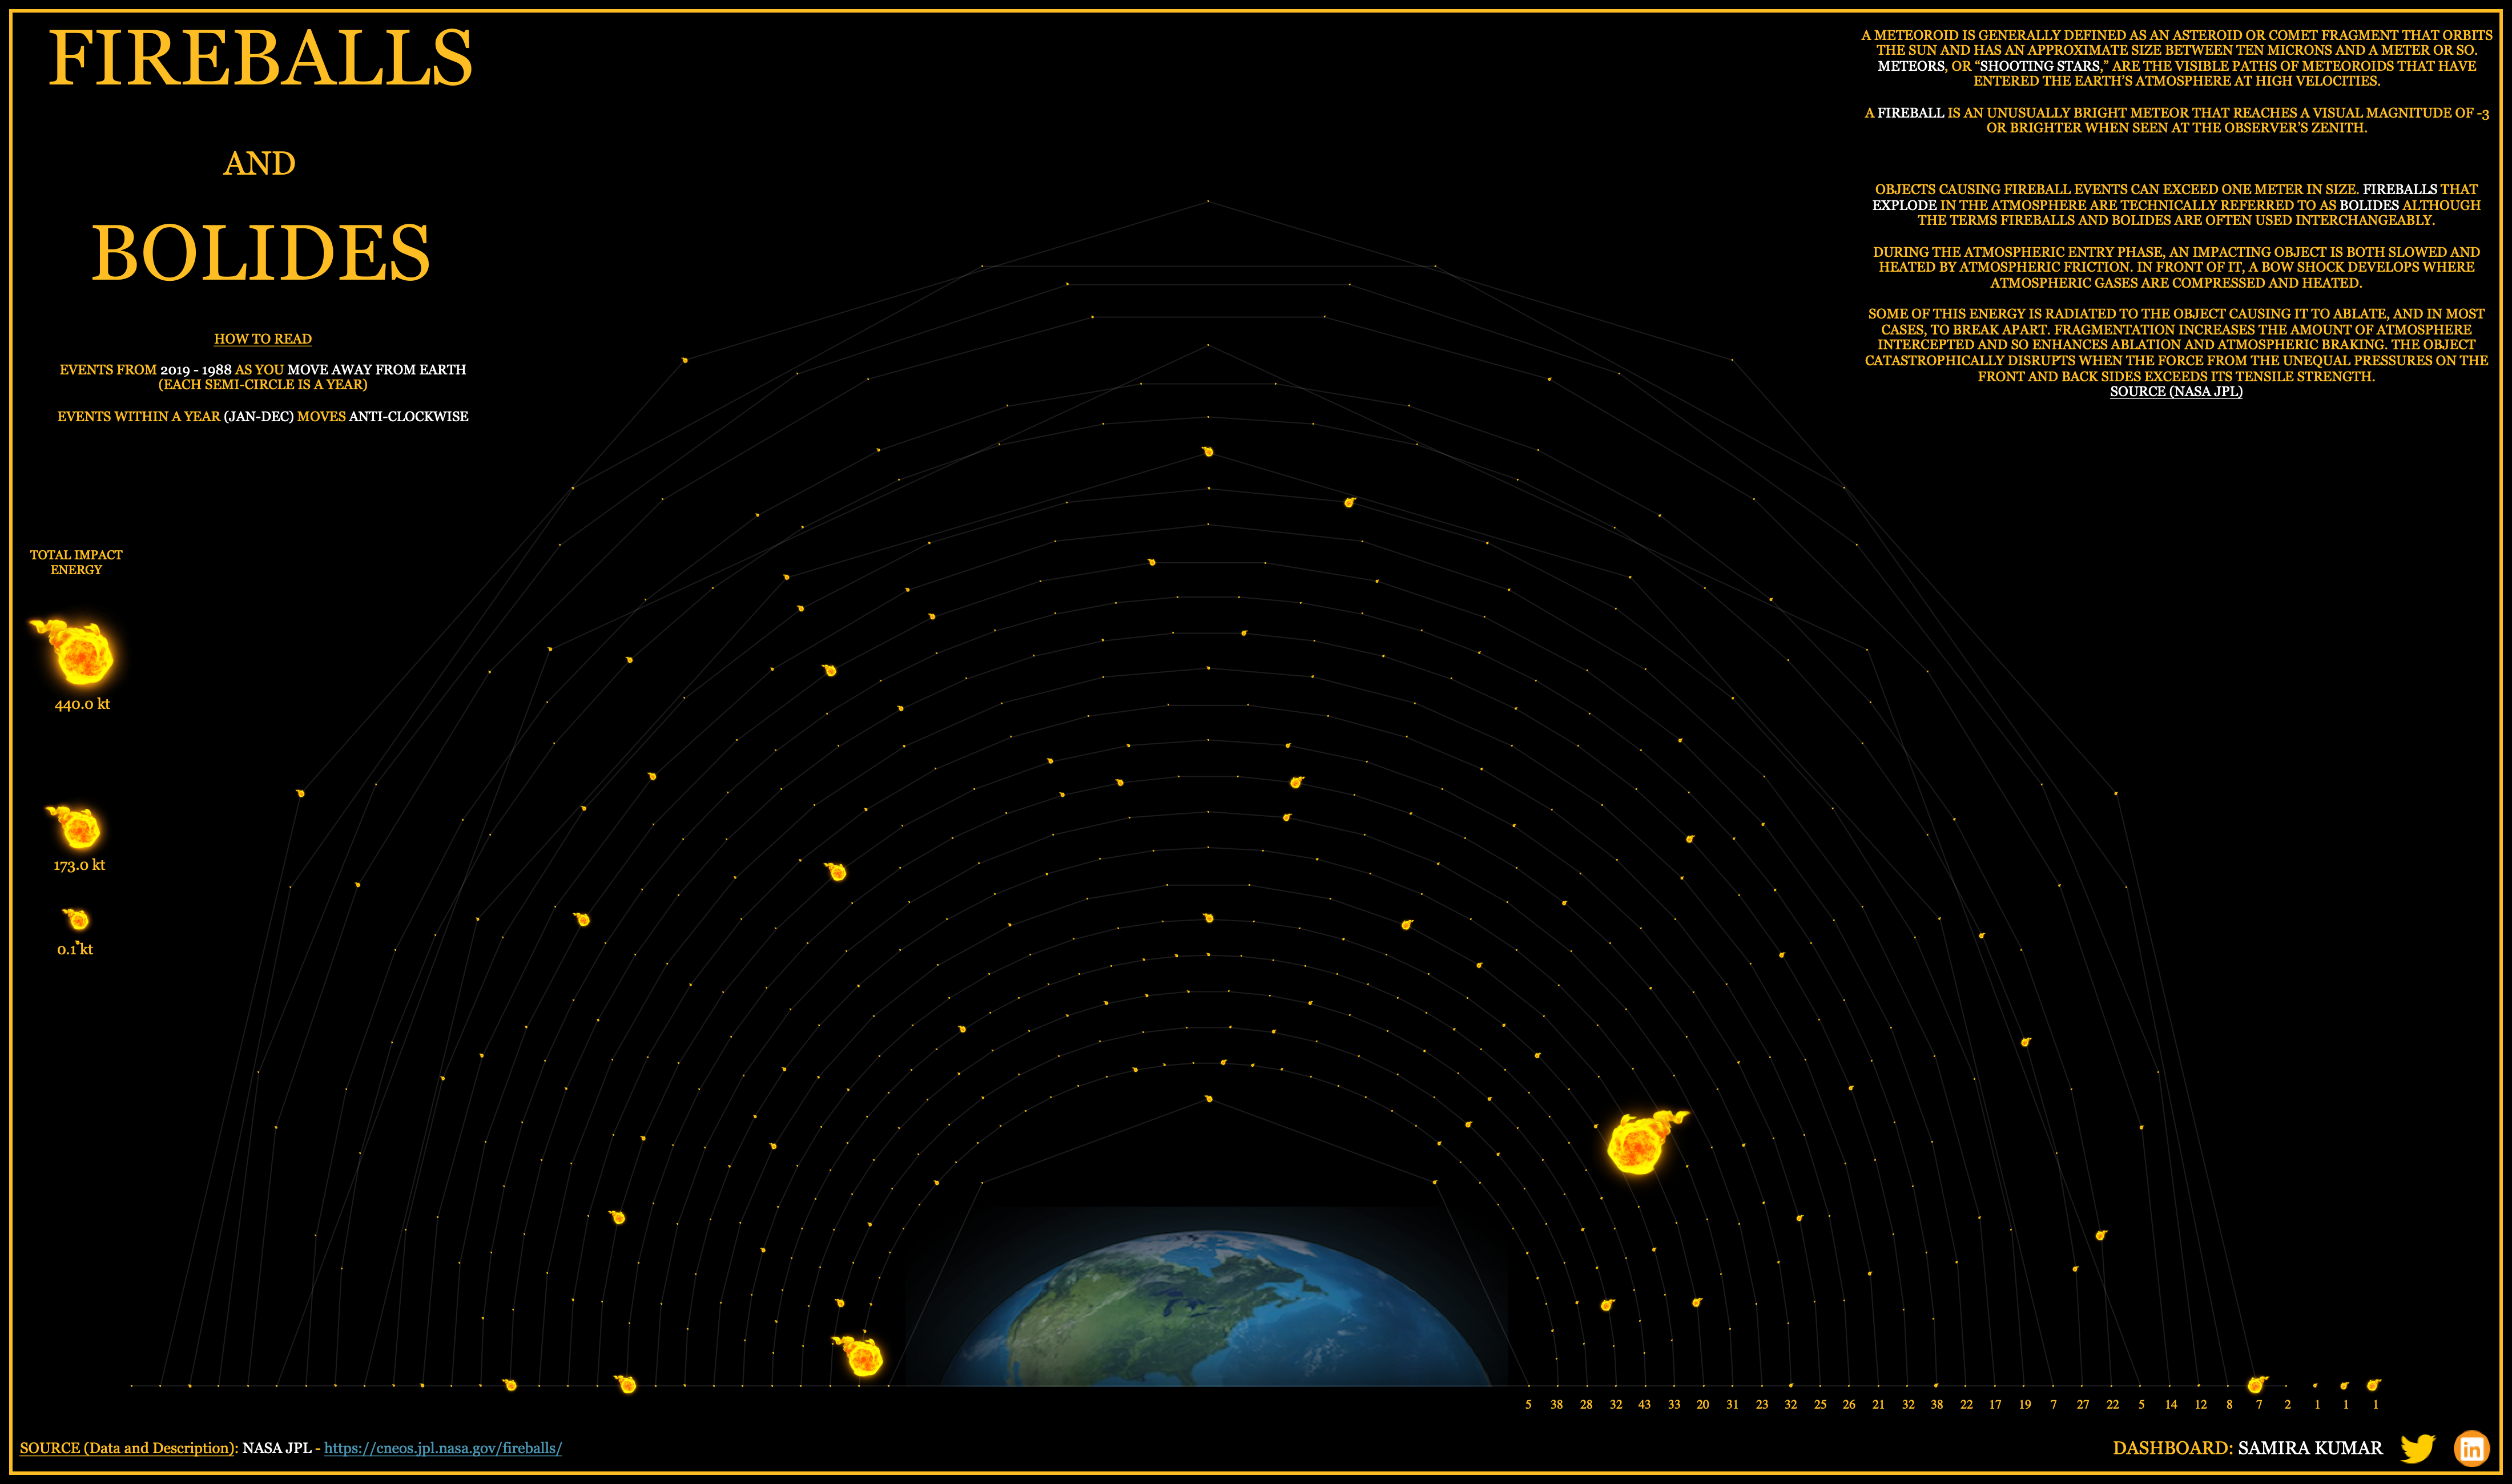
Visualizing Fireballs and Bolides
This post looks at creating a python script to automate the data collectiong and processing needed to build the visualization.
Data Source: NASA JPL: https://cneos.jpl.nasa.gov/fireballs/
Data Collection and Processing:
# Data Processing for making Fireball Viz

#Import packages

import pandas as pd
import numpy as np
import matplotlib.pyplot as plt
import requests
from math import pi

#Use NASA JPL API to get data

r = requests.get("https://ssd-api.jpl.nasa.gov/fireball.api")
df=pd.DataFrame(r.json()['data'],columns=r.json()['fields'])

#Dropping fireballs with nan in either latitude or longitude

df=df.dropna(subset=['lat','lon']).reset_index(drop=True)

#Setting proper format to date and extracting year from them

df['date']=pd.to_datetime(df['date'])
df['Year']=pd.to_numeric(df['date'].map(lambda x: x.strftime('%Y')))
group=df.groupby('Year')
angle_list=[]

#For each group of years, calculating angle to make the plot

def split_into_parts(n_parts):
    return np.linspace(0, 180, n_parts)

for i,v in group:
    l=len(v)
    angle = 0
    angle_list.append(split_into_parts(l))

#Get all angles into a flat list

flat_list = [item for sublist in angle_list for item in sublist]
df=df.sort_values('date',ascending=True)
df['Angle']=flat_list

#Creating a new dataframe to get diamter for each year.
#Recent years are closer to earth (lesser diameter).
#Then merging this dataframe to df

years=df['Year'].unique().tolist()
year_pd=pd.DataFrame({'Year':years[::-1],
             'Diameter':np.arange(1,len(years)+1)})
df=pd.merge(df,year_pd)

#Now find x and y point to plot it later.

x_orbit,y_orbit=[],[]
for i,v in df.iterrows():
    x_orbit.append((v['Diameter']+1)*(np.sin(v['Angle']*pi/180)))
    y_orbit.append((v['Diameter']+5)*(np.cos(v['Angle']*pi/180)))
df['X_Orbit']=x_orbit
df['Y_Orbit']=y_orbit

#Extra step to make the shape look good
#(all fireballs images are focused towards earth) ;)

fireball_image=[]
for i,v in df.iterrows():
    if v['Angle']<90:
        fireball_image.append(1)
    else:
        fireball_image.append(0)

df['fireball_image']=fireball_image
#Save the file to a csv to import it to tableau
df.to_csv('processed_fireballs_python.csv',index=False)
The entire code can be found here: Code
After this, the data is fed into Tableau to make the chart.
Link to viz: https://public.tableau.com/profile/samirak93#!/vizhome/Fireball/Main?publish=yes
Final Viz:
Feedbacks are appreciated!!